RMS Integration
Merging legacy systems with modern solutions to elevate restaurant management to the next level.

MY ROLE
I oversaw the end-to-end UX/UI design process, collaborating closely with the product team from research through project planning. I also provided guidance to the UX/UI designer on high-level data visualisation and mockups, ensuring alignment with project goals and user needs.
DURATION
March - September 2019
BACKGROUND
The previous Restaurant Management System (RMS) was launched in 2010. It allowed restaurants to update their operational information and respond to diners’ comments, which were displayed on the Openrice website and app.
Since the launch of the new platform OpenRice Biz - Merchant Web (MW) in 2016, RMS has become redundant and the integration of both platforms is vital. The updated RMS should offer more advanced features that align with modern technology, as well as merging seamlessly with existing B2B functionalities to enhance the overall user experience.
THE PROBLEMS
-
Outdated User Interface: The UI design appears dated and lacking modern visual elements like flat design and clean layouts. The outdated design of RMS website made it impossible to attract new restaurants for subscription.
-
Non-Responsive Design: The system was not optimised for mobile devices, leading to poor usability on smartphones and tablets which are now commonly used by restaurant staff.
-
Lack of Feature-based Access: The system could not support feature-based access, creating limitations in planning subscription pricing. And without clarity on the business strategy and subscription model, it is challenging for the development team to effectively plan the integration.
-
Limited Feature Set: The RMS struggles to integrate with newer technologies and third-party services. Its outdated functionality lacks the value necessary to justify a subscription fee from users.
THE GOALS
-
Ensure that the integration of the RMS with MW is closely aligned with the overall business strategy.
-
Help define the subscription model and introduce feature-based access control.
-
Redesign the UI to be more user-friendly, contemporary, and to align with our MW branding.
-
Explore new functionality and implement advanced data visualisation to present restaurant performance metrics.

My Role
Solely responsible for all the hands-on UX/UI end-to-end design process, from initial concept to design implementation. Aaaaaaaaa aaaaaaaaaaaa aaaaaaa aaaaaaaaaaaaaa aaaaaaa aaaaaaaaaa aaaaaaaa aaaaaaa aaaaaaaaaa aaaaaaa aaaaaaaaaa aaaaaaaa
Date
May - August 2017
DESIGN PROCESS
Openrice was initially launched in Hong Kong in 1999 as a local web dining guide, and later developed into a one-stop online platform (web and app) with various dining features, such as restaurant reviews, photo uploads, reservations, discount vouchers, etc. Nowadays OpenRice has over 20,000 recorded restaurants and 5.4 millions registered users. It’s the #1 most popular dining platform in Hong Kong.
Openrice Biz was launched in 2016 as a B2B merchant platform specially developed for restaurant owners and employees. The Merchant App (MA) aims to be a one-stop management tool for all daily restaurant tasks, helping restaurants with their digital transformation need.
Previous RMS Website (Launched in 2010)

RESEARCH

It is crucial to consider that all features can be subscribed to separately. Therefore restaurants need to be clearly informed about which features they have subscribed to or which have expired. A promotion section for new features should be included as well.
GATHERING REQUIREMENTS
The RMS integration planning involved a comprehensive assessment of service functions, business model, development complexity and project timeline. We began by conducting interviews with key stakeholders to understand business objectives and user needs, as well as gathering insights from the product, sales and marketing teams.
All requirements were consolidated and documented in a shared file for further evaluation and prioritisation. Clear communication channels were established between the business and development teams to ensure a mutual understanding of the integration requirements, constraints and dependencies.
Tech’s Perspective : Confusions on IA, user roles, and notifications settings.

COMPETITOR ANALYSIS
I analysed the key features offered by competitors to identify areas where our system could be improved or where it already has an advantage. This also helped determine what makes the RMS unique and how it can be positioned as a competitive option in the market.
Tech’s Perspective : Confusions on IA, user roles, and notifications settings.


RMS Lite - All existing MW users would be subscribed automatically
RMS Standard - All users from old RMS would be subscribed until their contracts expire.
RMS Premium - New subscription required for access to advanced features (eg. Statistics, Social Interaction)
FUNCTIONAL AUDIT
By integrating insights gathered from stakeholder interviews and competitor analysis, I conducted a comprehensive functional audit to identify and document all features and functionalities. These were then categorized into different tiers.
After several discussions, we came up with 3 subscription plans: Lite, Standard, and Premium.
Tech’s Perspective : Confusions on IA, user roles, and notifications settings.
IDEATE

Insights :
Action taken the most : Create booking offer / Create coupon / Verify diner’s offer (scan QR code)
Action taken the least : Check inbox / notifications
CART SORTING
A card sorting workshop was conducted with the product team to determine the optimal grouping of menu items when we integrate RMS with Merchant Web. This aims to guide our design decisions on the information architecture by aligning it with user expectations, and to provide valuable insights into user preferences and mental models.
To help the development team understand all user permissions, we created a specification document summarising all interactions and permissions for these three roles. This document also facilitated discussions on any constraints we needed to consider when designing the final UI.


Insights :
Action taken the most : Create booking offer / Create coupon / Verify diner’s offer (scan QR code)
Action taken the least : Check inbox / notifications
INFORMATION ARCHITECTURE
After completing the card sorting, I mapped out the current RMS architecture and identified areas for integration with different subscription plans. I used the insights to structure the IA by grouping features into logical categories and hierarchies. I also got the dev team to be involved in this stage to ensure technical feasibility and alignment with the new system’s capabilities.

My Role
Solely responsible for all the hands-on UX/UI end-to-end design process, from initial concept to design implementation. Aaaaaaaaa aaaaaaaaaaaa aaaaaaa aaaaaaaaaaaaaa aaaaaaa aaaaaaaaaa aaaaaaaa aaaaaaa aaaaaaaaaa aaaaaaa aaaaaaaaaa aaaaaaaa
Date
May - August 2017
WIREFRAMES
I developed wireframes to help different teams visualise user flows and focus on the structure, layout and navigation. These wireframes were particularly useful for the Statistics section as they facilitated in-depth discussions about data structure and presentation. This allowed us to collaborate effectively with the IT team to assess whether existing data was sufficient for the proposed visualisations. We also shared the wireframes with stakeholders for feedback, refining them based on their input to ensure alignment with project goals.
Users’ Perspective : Confusions on UX copy and clickable area/buttons.
Tech’s Perspective : Confusions on IA, user roles, and notifications settings.
DESIGN

My Role
Solely responsible for all the hands-on UX/UI end-to-end design process, from initial concept to design implementation. Aaaaaaaaa aaaaaaaaaaaa aaaaaaa aaaaaaaaaaaaaa aaaaaaa aaaaaaaaaa aaaaaaaa aaaaaaa aaaaaaaaaa aaaaaaa aaaaaaaaaa aaaaaaaa
Date
May - August 2017
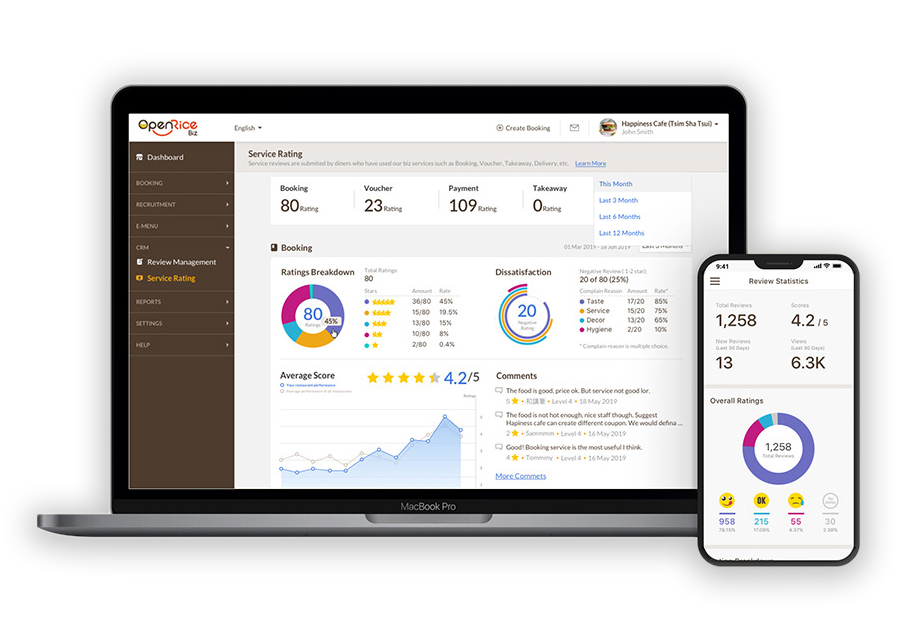
HIGH FIDELITY MOCKUP
High-fidelity mockups were crucial in the integration project as they provided a detailed and realistic representation of the final user interface. These mockups enabled direct comparisons between the old UI and the new UI, ensuring alignment with the Merchant Web branding after integration.
By refining visual details, we could effectively communicate the precise appearance of the product to stakeholders and the dev team, leading to smoother handoffs and ensuring a clear, fresh and intuitive experience for users.
Tech’s Perspective : Confusions on IA, user roles, and notifications settings.
PROJECT STATUS
The RMS Integration project was initially scheduled to begin in Q1 2020, but was put on hold due to the unexpected outbreak of COVID-19. As the pandemic unfolded, the immediate needs of the business shifted drastically. Resources and attention were redirected toward implementing ad-hoc features specifically designed to address the challenges posed by the pandemic. This change was necessary to support restaurants during the crisis and therefore pushing the RMS integration to a later stage.
Tech’s Perspective : Confusions on IA, user roles, and notifications settings.
View More Works
Redesigned the one-stop restaurant management app, contributing to a 116% increase in restaurant subscriptions.

Seamless integration of online and offline experiences for the dining industry.

Boosting conversion rates and driving sales growth through improved user experience, visual consistency and brand identity.

Merchant Web (2019)


Insights :
Action taken the most : Create booking offer / Create coupon / Verify diner’s offer (scan QR code)
Action taken the least : Check inbox / notifications
DATA VISUALIZATION
Data visualisation is essential to help restaurant managers quickly understand their key performance metrics and track trends. Over the years Openrice has collected numerous restaurant and dining data and it’s essential to turn those complex data into easy-to-digest visual formats. I started by researching types of charts/graphs and also organising and auditing existing data to define our key metrics visualisation.